
Bulls are still in control of the markets as seen from the increasing market cap. The global market cap has recorded a 0.5% pump in the last 24 hours to stand at $2.32T as of press time while the trading volume dropped by 16% to $110.6B.
Bitcoin pris recension
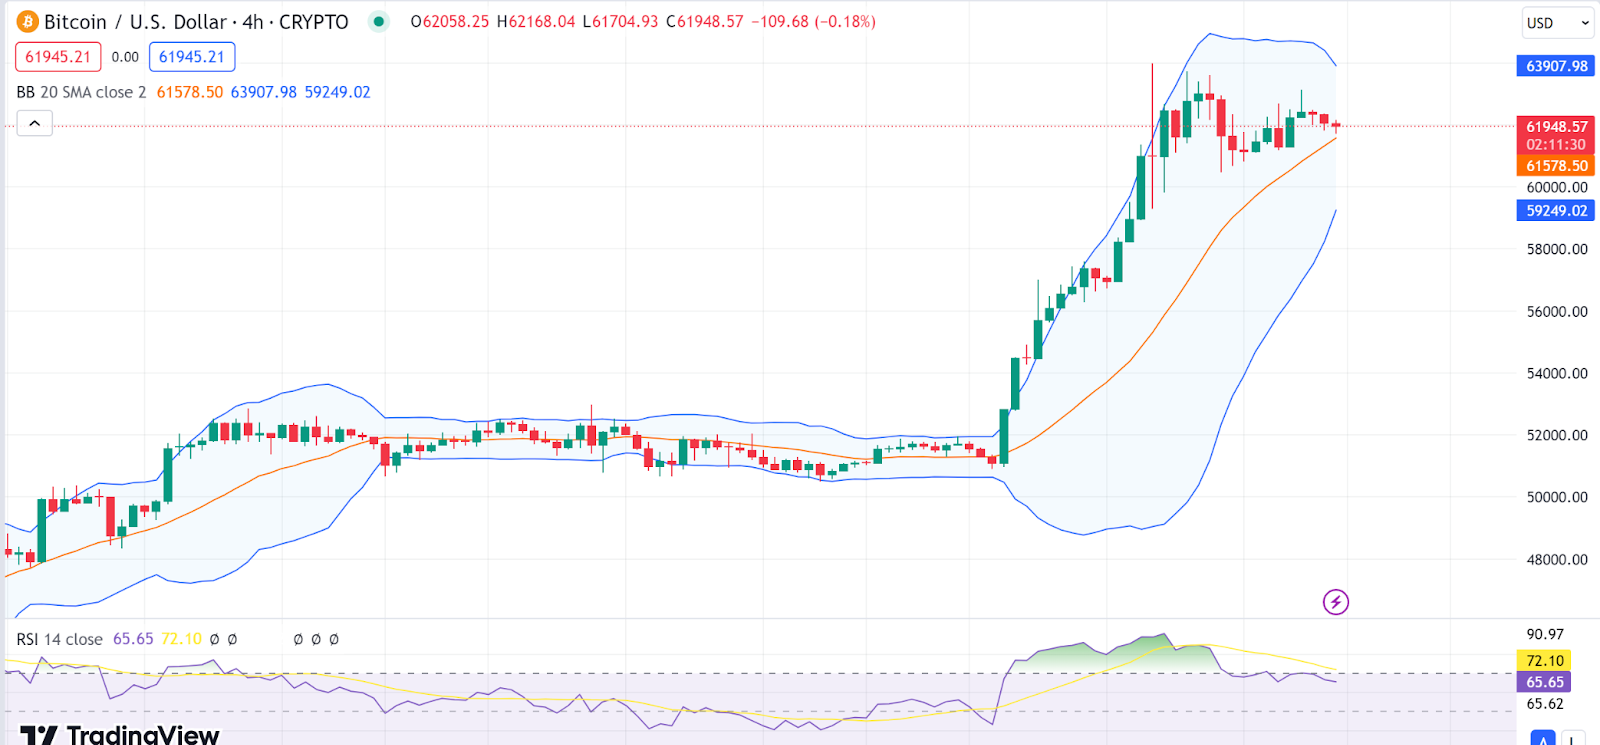
The Bitcoin (BTC) chart shows a recent uptrend with the price moving above both the 20-period simple moving average (SMA) and the Bollinger Bands (BB). The BB are widening, indicating increased volatility. The Relative Strength Index (RSI) is around 65, which suggests that the asset is neither overbought nor oversold.

The *BTC* price consolidation after the uptrend could suggest a period of indecision among traders. The Bitcoin price stood at $61.9K as of press time, representing a 0.44% dump in the last 24 hours as the crypto king now enters a consolidation phase.
Ethereum Prisrecension
Ethereum’s (ETH) chart also indicates an uptrend with the price above the Supertrend indicator, which may signal a bullish market condition. The Average Directional Index (ADX) is around 25, suggesting a moderate trend strength.
The *ETH* seems to be consolidating with a slight pullback towards the Supertrend line, which might act as support. The Ethereum price stood at $3412 as of press time, representing a 0.3% pump in the last 24 hours as ETH also failed to live up to today’s trend.

Pepe Price recension
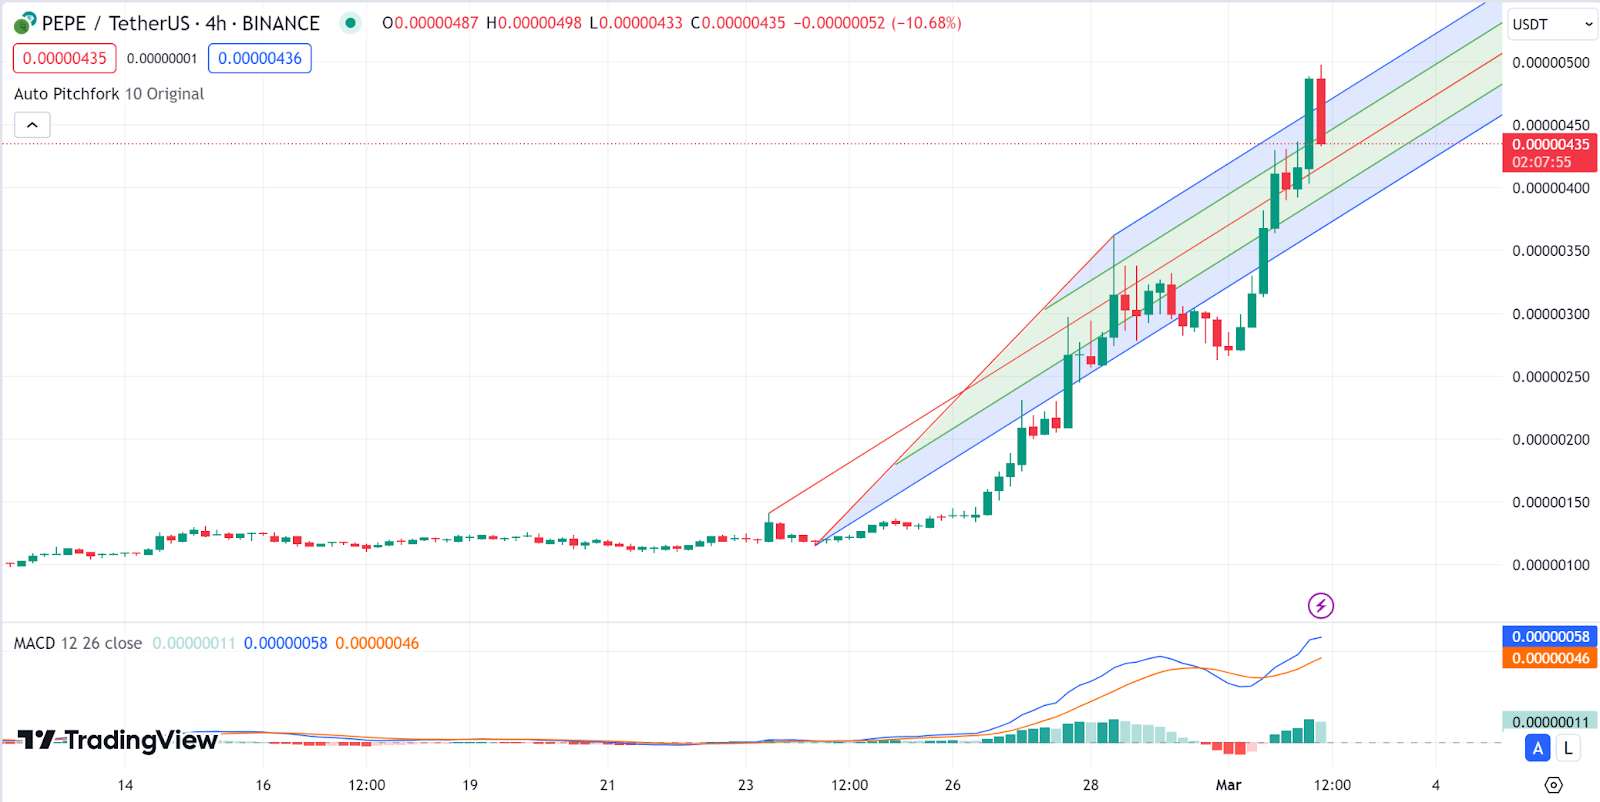
The Pepe price chart shows a strong uptrend within an Auto Pitchfork channel, with the price maintaining above the median line of the channel. The Moving Average Convergence Divergence (MACD) is above the signal line and above zero, which is bullish.
However, the recent red candles indicate a potential pullback or consolidation phase. The Pepe price stood at $0.000004441 as of press time, representing a 43% pump in the last 24 hours.
Dogwifhat prisrecension
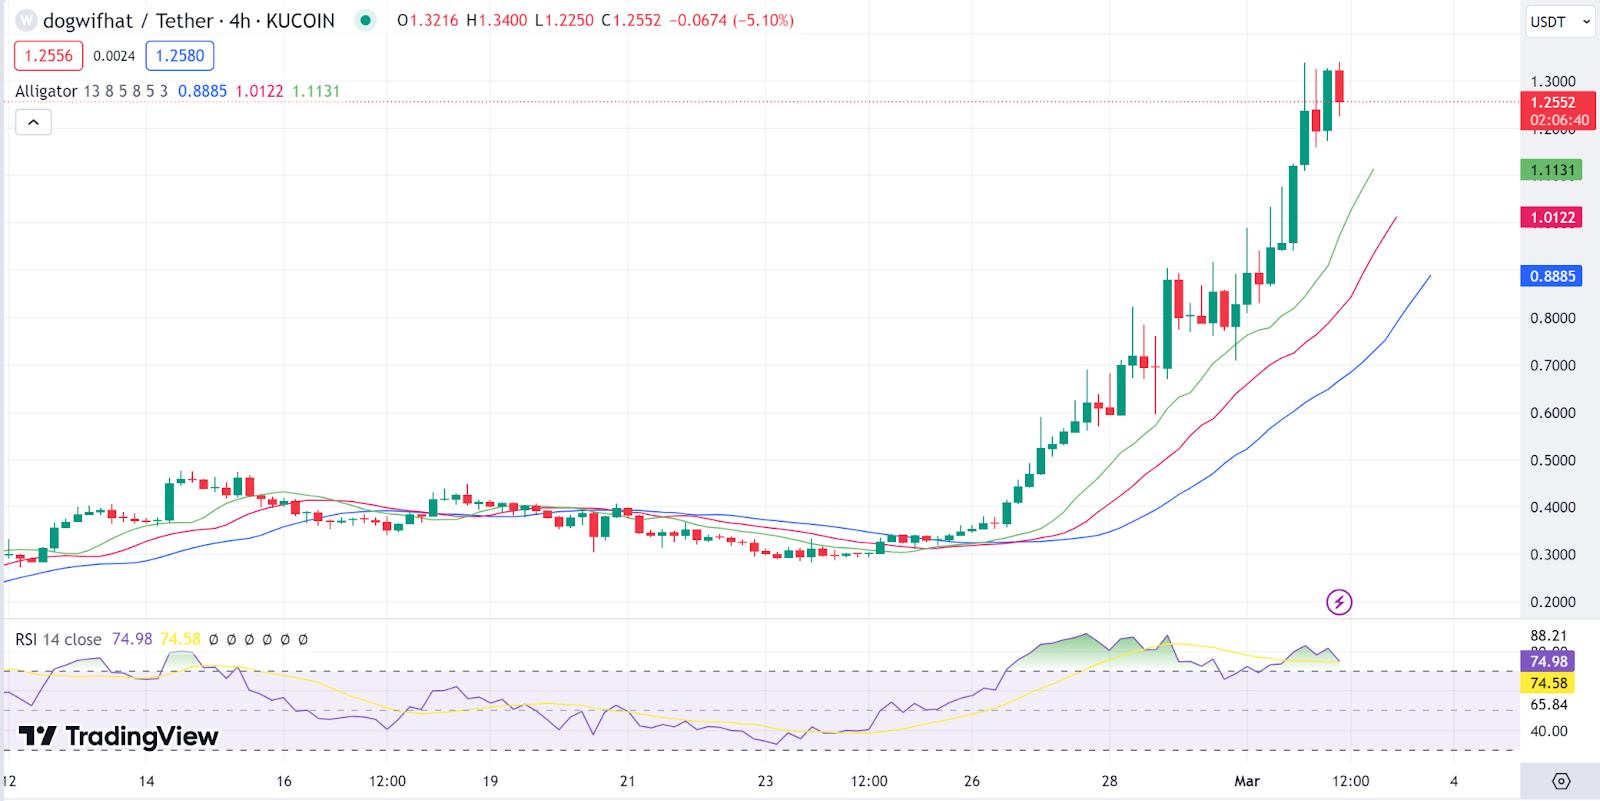
Looking at Dogwifhat (WIF) charts, we notice the asset is experiencing a strong bullish trend as evidenced by the Alligator indicator, with the Dogwifhat price trading above the lips, teeth, and jaw of the Alligator.
The RSI is high at around 75, close to the overbought territory, which could signal a potential retracement or pause in the trend. The Dogwifhat price stood at $1.32 as of press time, representing a 35.1% pump in the last 24 hours.
Fetch.AI Price Review
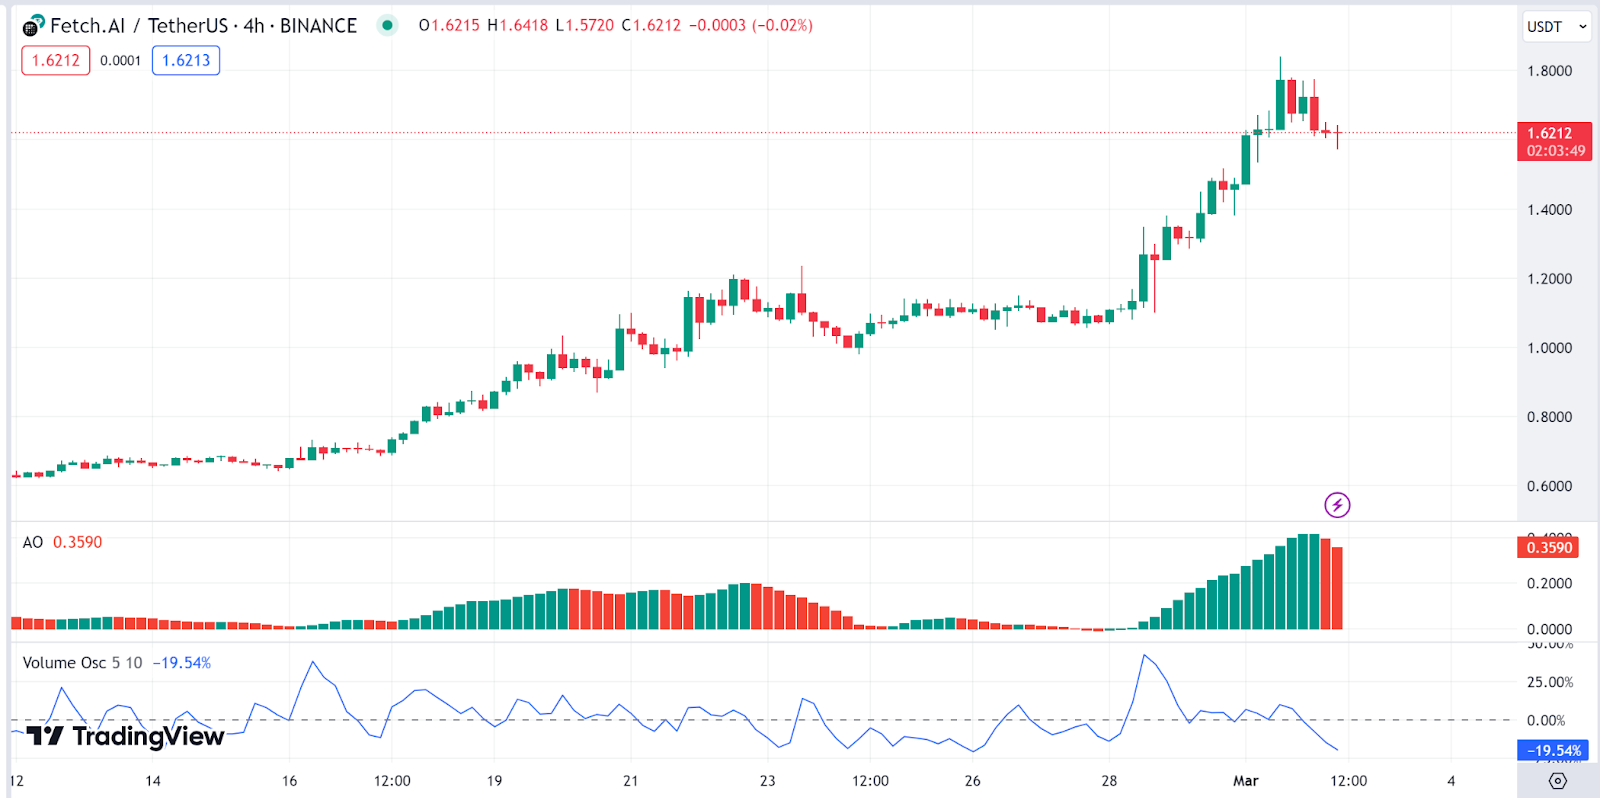
Fetch.AI’s (FET) chart shows a sustained uptrend with the price action forming higher highs and higher lows. The Awesome Oscillator (AO) is positive, indicating bullish momentum in the short term.
However, the Volume Oscillator is negative, suggesting a decrease in volume on up moves, which could indicate weakening momentum or potential consolidation. The Fetch.AI price stood at $1.61 as of press time, representing a 2.2% dump in the last 24 hours.
Source: https://blockchainreporter.net/daily-price-review-btc-eth-pepe-wif-fet/